In early 2019, I was working on an app (Mental Canvas Draw) that was in private beta on the Windows Store. There was a nice, robust system to show you which crashes were most common your app. Then suddenly – it disappeared, and instead there was a big stream of “Unknown” class crashes.
This caused much wailing and gnashing of teeth. I assumed that it would be fixed. Microsoft had recently acquired HockeyApp and was revamping it into Visual Studio AppCenter. Surely that would provide a replacement! Six months passed, a year passed, two years passed, and… nothing for C++ users. (I understand that AppCenter provides a solution for C# users.)
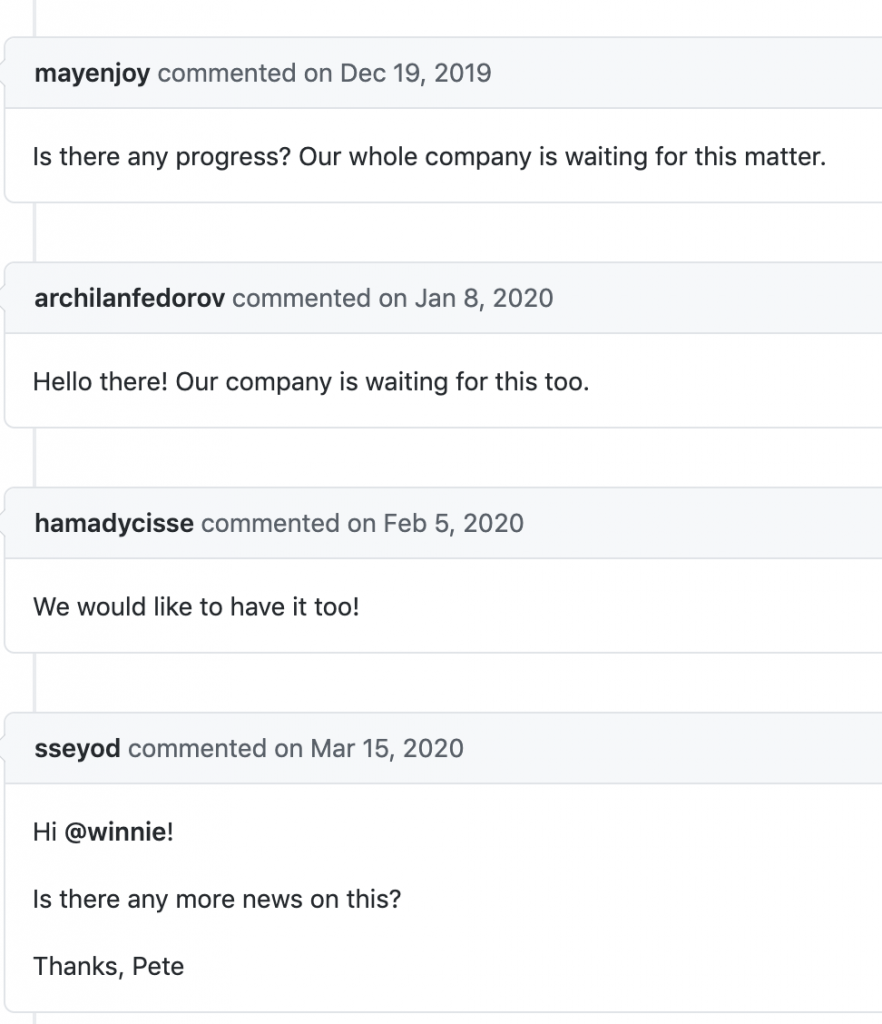

That app was released widely in March 2021, and I realized an important fact: if you have a large volume of users and/or crashes, you get a valid list of stack traces! There seems to be something about the level of usage per package version that’s important. For <100 crashes per version, I get 0% stack traces; for <250 I get very few; and for the version with 750 crashes I get good (64%) stack traces.
| Sample size | Filter Type | % Unknown | % Stack Traces |
| 1,051 | None | 50% | 50% |
| 750 | Package version | 36% | 64% |
| 485 | OS version | 54% | 46% |
| 316 | OS version | 34% | 66% |
| 234 | Package version | 86% | 14% |
| 110 | OS version | 50% | 50% |
| 100 | OS version | 99% | 1% |
| 66 | Package version | 100% | 0% |
Even for the “higher usage” package version, however, I’m still not getting solid data on the “rare” crash types – just the frequent crashes.
So… what’s to be done? We don’t have access to any off-the-shelf Win32 crash reporting tools, as the necessary APIs are all blocked off from UWP apps. There’s no easy way to get a minidump. There might be some really elaborate solution involving Project Reunion APIs to monitor the UWP process from Win32-land, but I haven’t explored those technologies much, and I’m not confident that the Win32 code gets sufficient privilege to dig deep on the UWP process’ behaviour.
But… UWP apps do have access to one key API: CaptureStackBackTrace.
IO ABIA PONIDO MEME GATO
A full-fledged crash handling and stack trace solution is quite complicated: running in a separate guard process to sidestep any memory/stack corruption; multiple threads; full analysis of both the app portion of the stack trace and the system (Windows) portion. My main needs were more narrow, and I built a solution focused on that
- Single thread: only show stack of active (crashing) thread
- App portion of stack is critical; system/Windows portion is desirable, but less important
- Severe memory corruption doesn’t need to be handled initially
- Only handle C++/CX and x64. It probably works for other situations, but that’s all I’ve tested to date.
With those criteria, I came up with a five-part solution:
- Pre-crash: log system info to disk
- Crash time: set a callback to get notified, and capture stack to disk
- Next app startup: transmit log+stack trace to server
- [OPTIONAL] Server: symbolify stack trace
- [OPTIONAL] Server: aggregate results
Let’s take a quick look at each piece.
GATE.IO USA INICIAR SESIÓN
When the crash happens, we want to do the bare minimum necessary. Memory may be corrupted and we want to avoid crashing while trying to log the crash. So: we log system information to disk at startup, prior to any crash happening. We particularly need the app version and the operating system version in order to be able to symbolify the stack trace, and the date/time of the session; but of course other data (screen size, RAM available, graphics driver versions, etc.) may also be relevant.
PUERTA EN REINO UNIDO
There are several potential mechanisms to get notified on crashes:
- Assertion failures (if enabled in production): it’s easy enough to write a custom assertion macro that captures __LINE__ and__FILE__ to get the source location of a failure, and it can then also trigger capture of a stack trace.
- Invalid memory access: the best bet seems to be
__try/__catch/_set_se_translatorfor Windows Structured Exception Handling (SEH)
These were also options, but didn’t seem to actually get called for relevant situations like null pointer dereferences:
- A different SEH Win32 C API:
SetUnhandledExceptionFilter
- UWP event handlers:
Windows::ApplicationModel::Core::CoreApplication::UnhandledErrorDetectedandWindows::UI::Xaml::UnhandledException
What is SEH? It’s a C API that handles hardware exceptions on x86/x64 chips; while it uses the __try and __catch keywords, it’s not about software exceptions (either C++ or managed code). There’s some good discussion of it in the CrashRpt documentation. It’s a key part of Microsoft’s own error reporting mechanism, from the Dr. Watson era through to today. (I believe the rough data path is SEH → Windows Error Reporting (WER) → Microsoft-hosted database → Windows Store stack traces.) There are all sorts of complicated nuances to how it works, and I’ve understood… relatively few of them. I just use the _set_se_translator function as a hook to:
- Get called when a crash happens, on the crashing thread.
- Grab a stack trace and record it (typically skipping the first 8 frames that are in VCRUNTIME and NTDLL)
- Also grab and record the exception type (EXCEPTION_ACCESS_VIOLATION, EXCEPTION_STACK_OVERFLOW, etc.)
A single call to _set_se_translator appears to be sufficient to get a callback when any thread crashes. (Which is the main reason I use it instead of __try / __catch or _set_terminate, which have to be applied on a per-thread basis.)
The actual implementation is pretty straightforward:
#include <eh.h>

void se_trans_func( unsigned int u, _EXCEPTION_POINTERS *pExp) {
  // Skip 8 stack frames - we usually see the ones below.
  // 00:MyApp.exe+0x009a7b98		(this function)
  // 01 .. 05:VCRUNTIME140D_APP.dll
  // 06 .. 08:ntdll.dll
  Char *backTrace =GetBackTrace(8);
  Str desc;
  switch (u) {
  case EXCEPTION_ACCESS_VIOLATION:
    desc = L"ACCESS_VIOLATION";	     break;
  case EXCEPTION_ARRAY_BOUNDS_EXCEEDED:
    desc = L"ARRAY_BOUNDS_EXCEEDED"; break;
  // ... etc. ...
  case EXCEPTION_STACK_OVERFLOW:
    desc = L"STACK_OVERFLOW";        break;
  default:
    desc = StrPrintf(TEXT("%d"), u); break;
  }

  LogPrintf(L"Structured Exception Handling failure type %s. Stack trace:\n%s\n"),
    desc.Data(), backTrace);
  delete[] backTrace;

  // A bit irrelevant... we mostly just want the stack trace.
  throw L”Hardware exception”;
}

App::App() {
  // ...
  _set_se_translator(se_trans_func);
  // ...
}
PIEL CHICO GATO BONK IO
From a UWP app, we don’t have access to many Win32 APIs – but we can call CaptureStackBackTrace. If we combine that with calls to RtlPcToFileHeader and GetModuleName, then we can get the module name (EXE and DLL filename) and the offset within that module for each entry in the stack trace. Unlike conventional Win32 crash handlers, we cannot symbolify at crash time. We get a module-relative offset:
myapp.exe+0x00001234
Rather than the symbolified (actual function name and signature) with a function-relative offset:
myapp.exe crashyFunction(int, const std::string &) + 0x0000001a
Or even better, with source filenames and line numbers:
myapp.exe crashyFunction(int, const std::string &) + 0x0000001a
myapp.cpp:465
In theory, you could try to walk the module’s PE header data manually with an IMAGE_DOS_HEADER to get the IMAGE_EXPORT_DIRECTORY for the exported symbols from each module. But in practice, we need non-exported private function names, for both trace entries in our code and in Windows DLLs.
So – there’s no API call to do the symbolification locally in-app. We’ll have to do it out-of-app with the help of a server. Given that situation, we just dump the CaptureStackBackTrace outputs to disk, and let the app merrily crash.
The actual capture code looks like this:
Str GetBackTrace(int SkipFrames)
{
  constexpr uint TRACE_MAX_STACK_FRAMES = 99;
  void *stack[TRACE_MAX_STACK_FRAMES];
  ULONG hash;
  const int numFrames = CaptureStackBackTrace(SkipFrames + 1, TRACE_MAX_STACK_FRAMES, stack, &hash);
  Str result = StrPrintf(L"Stack hash: 0x%08lx\n", hash);
  for (int i = 0; i < numFrames; ++i) {
    void *moduleBaseVoid = nullptr;
    RtlPcToFileHeader(stack[i], &moduleBaseVoid);
    auto moduleBase = (const unsigned char *)moduleBaseVoid;
    constexpr auto MODULE_BUF_SIZE = 4096U;
    wchar_t modulePath[MODULE_BUF_SIZE];
    const wchar_t *moduleFilename = modulePath;
    if (moduleBase != nullptr) {
      GetModuleFileName((HMODULE)moduleBase, modulePath, MODULE_BUF_SIZE);
      int moduleFilenamePos = Str(modulePath).FindLastOf(L"\\");
      if (moduleFilenamePos >= 0)
        moduleFilename += moduleFilenamePos + 1;
      result += StrPrintf(L"%02d:%s+0x%08lx\n"), i, moduleFilename,
        (uint32)((unsigned char *)stack[i] - moduleBase));
     }
     else
       result += StrPrintf(L"%02d:%s+0x%016llx\n"), i, moduleFilename,
         (uint64)stack[i]);
   }
   return result;
}
FTX O GATEIO
The UWP lifecycle APIs let us detect whether the last run of the app had a clean exit. We can use that to detect a crash, and transmit the recorded log to our server for symbolification. It does mean that we don’t get crashes immediately, and we may miss crashes if the user doesn’t restart the app. But in practice, this is largely acceptable.
We do try to capture the app version and crash date/time in our log, as the version and date may be different by the time the log is transmitted.
LISTADO GATEIO
The server is – by necessity – a Windows VM listening to HTTPS requests.
On the server, we maintain a set of PDB files for each app version (extracted from the .msixpackage zip file). At present, we only handle x64 and not ARM64 crashes.
We also maintain a set of key system DLLs for each major (semiannual) Windows release. We don’t try to keep the DLLs for each minor release, as that’s basically a Herculean task.
When a log file comes in, we:
- Parse the log to retrieve the app version and Windows version
- Match up the relevant PDB file and directory of Windows system DLLs
- For each line of the stack trace, detect whether it’s in our app or a system DLL
- Run CDB.EXE to convert the module name + offset to a function name, offset, source filename and line number. The inspiration for this came from Raymond Chen’s oldnewthing blog.
The heart of this is the call to CDB, which looks like this:
export CDB=/mnt/c/Progra\~2/Windows\ Kits/10/Debuggers/x64/cdb.exe
# Typical raw output, prior to sed expressions:
#   MyApp!MyApp::App::CrashyFunction+0x25fb
#   [C:\Users\MyUser\source\myapp\MyApp.cpp @ 757]:
# Sed expressions simplify it to:
#   App::CrashyFunction+0x25fb [MyApp.cpp @ 757]
"$CDB" -lines -z myapp.exe -c "u $entry; q" -y \
  "cache*c:\\Symbols;srv*https://msdl.microsoft.com/download/symbols"\
  | grep -m 1 -A 1 "^0:000>" \
  | tail -1 \
  | sed 's/:$//;' \
  | sed 's/MyApp:://g;' \
  | sed 's/\[[^@[]*\\\([A-Za-z0-9_.]*.\(h\|cpp\) @ \)/\[\1/g'
For Windows system DLL entries, we can choose a $SYS32DIR to match the client’s Windows version, and then change the -z argument to
-z $SYS32DIR\\$DLLFILENAME
This ensures that CDB uses the client’s Windows version to decide which symbols to retrieve for the DLL, rather than the normal behaviour, which would use the server VM’s Windows version. We’ll still get a fair bit of mismatch – as we usually don’t have the DLLs that precisely match the client’s Windows version.
If there’s some way to specify a Windows version when telling CDB about the symbol server – let me know! That would be a huge timesaver.
CONTRASEÑA DE FONDOS EN GATE.IO
Ideally, we want to build a database of all stack traces, merge duplicates, and present a ranked list of the most common crashes over (say) a month, and a graph of the crash frequency of any given bug per day.
But I haven’t actually implemented this yet. For this purpose, an off-the-shelf tool will probably suffice – a service like Sentry or Visual Studio App Center would do the trick, and both accept submission of crash data via an API.
PUERTA IO AVAX A METAMASK
If you want a simpler solution: you can easily use the module name + module-relative offset in a Visual Studio debugger session to manually find the source location. This makes it painstaking to analyze each individual crash, but might be acceptable if you maintain a very low crash rate in your app. I took this route through 2019, but added stack trace capture by 2020 and finally built out the symbolification code in 2021 when it became obvious that Microsoft wasn’t going to fix this themselves.
COMO INGRESAR DINERO EN GATE.IO
So – this is a very bare bones process for detecting crashes, capturing a C++ stack trace, transmitting to a server and determining filename + line numbers for each entry in the stack trace.
I … still really wish Microsoft would just re-enable this code in the Microsoft Store. For the life of me, I can’t understand why they turned it off. They must still be collecting all this information in the WER database for their own use, and just not exposing it to developers.
 At
At  Imagine there are no variable names. Imagine working – in 2016 – with registers. Imagine one minute file load times. Imagine that all commands are just numbers. Imagine there’s no usable string processing.


 I recently found a neat XAML user interface trick that I hadn’t seen in my
